|
Below you will find projected finish times for each of Mocorunning's ranked runners as of Week 7 (10/16/2016). Scroll to
the bottom to read how the projected times were determined.
Girls 5k Projected County Times
========================================================================================
Pl	Name			School			Year	Time		Points
========================================================================================
1	Abigail Green		Walter Johnson		2018	17:18.4		1
2	Julia Reicin		Churchill		2017	18:31.4		2
3	Katriane Kirsch		Walter Johnson		2017	18:34.7		3
4	Yasmine Kass		Paint Branch		2018	18:41.7		4
5	Nandini Satsangi	Poolesville		2019	18:46.4		5
6	Heather Delaplaine	Damascus		2018	19:02.8		6
7	Zoe Nuechterlein	B-CC			2017	19:04.6		7
8	Helena Lee		Northwest		2020	19:06.4		8
9	Sofia Zarate		Northwest		2017	19:12.0		9
10	Virginia Brown		B-CC			2019	19:21.3		10
11	Janet Scott		Walter Johnson		2018	19:24.9		11
12	Paula Bathalon		Whitman			2020	19:25.0		12
13	Michaela Peterson	B-CC			2017	19:31.0		13
14	Morgan Casey		Blair			2018	19:33.9		14
15	Logan Rohde		Poolesville		2020	19:35.7		15
16	Sophia Scobell		Walter Johnson		2018	19:39.3		16
17	Josephine Brane-Wright	Blair			2018	19:39.3		17
18	Maya Jacobson		Quince Orchard		2017	19:39.9		18
19	Sadie Keller		Walter Johnson		2018	19:43.5		19
20	Jessica Trzeciak	Wootton			2019	19:43.7		20
21	Alexis Whitehorn-Coriz	Damascus		2020	19:44.8		21
22	Alexa Donaldson		Sherwood		2019	19:53.5		22
23	Nefrit El-Masry		R. Montgomery		2018	20:04.4		23
24	Katherine Ellis		B-CC			2017	20:06.2		24
25	Breanna McDonald	Whitman			2019	20:06.7		25
26	Margaret Lilyestrom	Quince Orchard		2019	20:08.8		26
27	Adna Trakic		Wootton			2019	20:10.1		27
28	Sofia Grossman		Sherwood		2019	20:13.4		28
29	Michelle Campano	R. Montgomery		2020	20:18.1		29
30	Devi Payne		B-CC			2017	20:18.4		30
31	Rachel Friedman		Whitman			2017	20:18.5		31
32	Elise Durr		Gaithersburg		2019	20:21.4		32
33	Erin Chelf		Wootton			2019	20:22.3		33
34	Gabriela Jeliazkov	B-CC			2019	20:23.0		34
35	Gwenyth Asbury		Churchill		2017	20:23.2		35
36	Alicia Lauwers		Whitman			2020	20:23.3		36
37	Bianca Zeigler		Northwest		2019	20:23.5		37
38	Lena Feldman		Whitman			2017	20:24.2		38
39	Madeline Grainger	Wootton			2019	20:25.5		39
40	Natalie Nyborg		Quince Orchard		2019	20:27.4		40
41	Amelia Guenterberg	Sherwood		2018	20:28.4		41
42	Isadora Germain		Blair			2018	20:30.3		42
43	Anaiah Little-Diop	B-CC			2018	20:30.4		43
44	Gwen Klein		Wootton			2017	20:31.6		44
45	Isabelle Sajonia	Quince Orchard		2018	20:32.4		45
46	Helena Abbott		Walter Johnson		2019	20:32.9		46
47	Olivia White		Churchill		2017	20:35.4		47
48	Kathy Pena-Molina	Magruder		2018	20:37.0		48
49	Leah Kannan		Blair			2020	20:38.7		49
50	Valerie Hubert		Wootton			2017	20:40.2		50
51	Lara Shonkwiler		Blair			2017	20:42.2		51
52	Lilly Dirlik		Einstein		2018	20:42.6		52
53	Eva Loewenstein		Springbrook		2019	20:43.1		53
54	Lauren Zhou		R. Montgomery		2019	20:44.5		54
55	Sage Kumar		Wootton			2019	20:44.5		55
56	Alyssa D'Arpa		Wootton			2020	20:45.6
57	Leah Peloff		Sherwood		2018	20:45.7		56
58	Julia Johnson		Whitman			2019	20:46.2		57
59	Anna Baldwin		Wootton			2020	20:48.0
60	Anna O'Keefe		B-CC			2019	20:49.9
61	Dimagi Kottage		Wootton			2019	20:51.8
62	Lauren Kuo		Churchill		2020	20:52.0		58
63	Emma Basset		R. Montgomery		2019	20:52.0		59
64	Marissa Branham		Northwest		2019	20:53.0		60
65	Madeline Cheng		R. Montgomery		2017	20:54.4		61
66	Megan Kendall		Sherwood		2019	20:56.6		62
67	Emma Walter		Walter Johnson		2018	20:57.0		63
68	Olivia Woods		Whitman			2017	20:57.6		64
69	Avery Jackson		Clarksburg		2020	20:58.5		65
70	Elizabeth Cassell	Quince Orchard		2018	21:00.0		66
71	Jasmine De La Vega	R. Montgomery		2018	21:01.1		67
72	Theresa Nardone		Poolesville		2017	21:01.9		68
73	Sierra Agarwal		Walter Johnson		2019	21:04.8

Teams with Five or More Ranked Runners
=========================================
Pl	School		Projected Points
=========================================
1	Walter Johnson		50
2	B-CC			84
3	Whitman			142
4	Wootton			163
5	Blair			173
6	Quince Orchard		195
7	Sherwood		209
8	Richard Montgomery	226

Teams with Four Ranked Runners: Churchill, Northwest
The Ranking Formula
Mocorunning's Ranking Formula is explained HERE.
The ranking formula compares runners in every race throughout the season and year after year. The finish times only
matter to the extent that finish times of all ranked runners will be compared and scored against all other ranked
runners in that race. After a meet is scored, there is a point exchange among the ranked runners. The net point exchange
will be zero with a few exceptions that I won't go into right here. One of the important things to know is that there is
no reward for running "fast times" and no penalty for running "slow times." In other words there is absolutely no
benefit to running a fast course like the DCXC course compared to a difficult course like Watkins Mill. The most
important thing for mobility within the ranking is beating other ranked runners by as many seconds as possible.
The ranking you see on this page exactly matches the names on the week 7 ranking published on 10/16/2016 with a couple
notable changes. Private school runners were removed and the points were replaced with projected finish times for the
county championship course at Gaithersburg. Do the points convert directly to 5k times? No, not exactly, but the points
do convert to a time scale. 1 second = 2 points. Therefore, if the top ranked runner had 200 points, he would be ranked
200 points or 100 seconds above the cutoff to make the ranking. You can assign that top ranked runner any 5k time, and
he would be 100 seconds (1:40) above the cutoff to make the ranking. Take any two runners and subtract their point
totals, divide by two, and you will know how far apart they are "supposed" to finish according to the ranking.
To assign the projected times to all the runners, you really only need to assign a projected time to one runner. Once
one runner has an assigned projected time, the point scale dictates the finish times for every other runner within the
ranking. It's not the first or last ranked runner that you want to key off of. It's the runners in the middle range that
will be the most consistent year after year. The great thing about the county championship is that we have the same
exact number of teams entered in the meet at the same time of the year, every year. Of course weather is also a factor,
but we have had great weather at the county meet for the last several years. The caliber of the middle tier varsity
runners will not fluctuate very much from year to year.
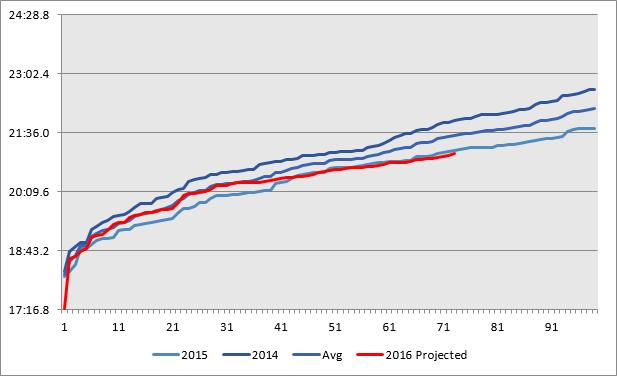
The chart below shows the county championship varsity race plotted for each of the last two years plus a line showing
the average finish time between those two years. The curve of the lines changed a good bit when the rules changed to
allow 10 runners in the varsity race in 2014 so we will only include the last two years. 2015 was far and away the
fastest race in history and it had to do with the race being run on a Monday afternoon on a beautiful day with dry
weather leading up to it. I am guessing that not every year will be the fastest year ever and we will regress back
towards a more typical year like 2014 (which also lines up pretty well with the previous three years). Under the
assumption that 2016 is an average year, meaning that this year's top 100 varsity high school runners are no better or
worse than a typical year, I want my RED projected line to land on the AVG line as closely as possible. I can't
manipulate the curvature of the red line. The curvature of the red line is dictated by the ranking/points system. I can
only move my red line up or down vertically which I did until I felt that I had the best overlay. Doing this exercise
ensured that the projections are in line with the history of the meet on this course.
|