|
Below you will find projected finish times for each of Mocorunning's ranked runners as of Week 7 (10/19/2015). Scroll to the bottom to
read how the projected times were determined.
Girls County Championship 5k Projections
================================================================================================
Rank	Name			School			Year	    Projected Time    Points
================================================================================================
1	Abigail Green		Walter Johnson		2018		18:34.6		1
2	Sami King		Whitman			2016		18:43.2		2
3	Bethlehem Taye		Paint Branch		2016		18:47.4		3
4	Emily Murphy		Walter Johnson		2016		18:55.2		4
5	Sophie El-Masry		Richard Montgomery	2016		18:58.8		5
6	Ciciely Davy		Einstein		2016		19:22.9		6
7	Grace Dellapa		Wootton			2016		19:25.1		7
8	Jasmine Garrett		Walter Johnson		2016		19:28.5		8
9	Zoe Nuechterlein	B-CC			2017		19:29.3		9
10	Virginia Brown		B-CC			2019		19:29.8		10
11	Amanda Hayes-Puttfarcken Sherwood		2016		19:30.1		11
12	Julia Reicin		Churchill		2017		19:34.2		12
13	Olivia Woods		Whitman			2017		19:41.2		13
14	Michaela Peterson	B-CC			2017		19:49.8		14
15	Sofia Zarate		Northwest		2017		19:54.5		15
16	Erin O'Connor		Whitman			2016		19:56.1		16
17	Abigail Levine		B-CC			2016		19:56.3		17
18	Nandini Satsangi	Poolesville		2019		19:58.7		18
19	Katriane Kirsch		Walter Johnson		2017		20:04.3		19
20	Mahlet Bauerle		Einstein		2016		20:12.5		20
21	Heather Delaplaine	Damascus		2018		20:12.6		21
22	Maddie Peloff		Sherwood		2016		20:15.4		22
23	Maya Jacobson		Quince Orchard		2017		20:17.2		23
24	Catherine Oberfield	Blake			2016		20:23.4		24
25	Katherine Ellis		B-CC			2017		20:23.9		25
26	Nefrit El-Masry		Richard Montgomery	2018		20:24.6		26
27	Riani Carr		Blake			2016		20:28.5		27
28	Fiona Whitefield	Poolesville		2016		20:28.6		28
29	Cynthia Kipserem	Richard Montgomery	2016		20:29.6		29
30	Josephine Brane-Wright	Blair			2018		20:31.9		30
31	Yasmine Kass		Paint Branch		2018		20:33.9		31
32	Isabelle Sajonia	Quince Orchard		2018		20:40.7		32
33	Holly Mordoff		Clarksburg		2016		20:42.8		33
34	Anaiah Little-Diop	B-CC			2018		20:44.0		34
35	Sarah Shapiro		Wootton			2017		20:44.3		35
36	Lily Lippert		Clarksburg		2018		20:44.6		36
37	Janet Scott		Walter Johnson		2018		20:49.3		37
38	Sadie Keller		Walter Johnson		2018		20:49.7		38
39	Eliana Krakovsky	Quince Orchard		2017		20:50.3		39
40	Margaret Lilyestrom	Quince Orchard		2019		20:50.9		40
41	Julia Johnson		Whitman			2019		20:51.1		41
42	Kayla Sadd		Clarksburg		2019		20:51.2		42
43	Lena Feldman		Whitman			2017		20:51.4		43
44	Marie Caspard		B-CC			2016		20:54.4		44
45	Lara Shonkwiler		Blair			2017		20:56.4		45
46	Anne Elliott		Damascus		2018		20:57.1		46
47	Bianca Zeigler		Northwest		2019		20:57.7		47
48	Adna Trakic		Wootton			2019		20:58.2		48
49	Madeline Grainger	Wootton			2019		20:58.2		49
50	Sophia Scobell		Walter Johnson		2018		20:58.7		50
51	Abigail Hines		Blake			2016		21:01.5		51
52	Flora Gobet		Whitman			2016		21:02.4		52
53	Devi Payne		B-CC			2017		21:02.7
54	Madison Silver		B-CC			2017		21:03.2
55	Gwen Klein		Wootton			2017		21:04.3		53
56	Emily Newcombe		Richard Montgomery	2016		21:05.0		54
57	Yasmine Boumaiz		Clarksburg		2016		21:05.5		55
58	Jasmine De La Vega	Richard Montgomery	2018		21:06.5		56
59	Courtney Cahill		Whitman			2018		21:06.8		57
60	Rachel Friedman		Whitman			2017		21:07.5
61	Victoria Haass		Churchill		2016		21:07.8		58
62	Isadora Germain		Blair			2018		21:08.5		59
63	Marissa Branham		Northwest		2019		21:09.5		60
64	Lisa Franco		Watkins Mill		2016		21:11.5		61
65	Leah Peloff		Sherwood		2018		21:11.5		62
66	Emma Walter		Walter Johnson		2018		21:12.0
67	Sabriana Carpenter	Clarksburg		2016		21:13.0		63
68	Ella Segal		Whitman			2017		21:13.7
69	Lananda Correia		Northwest		2017		21:14.7		64
70	Jane Griffin		B-CC			2018		21:15.5
71	Genevieve Zillich	Sherwood		2017		21:16.1		65
72	Cassady Kutz		Paint Branch		2018		21:16.5		66
73	Auriane Martin		Whitman			2018		21:18.3
74	Tess Horn		Churchill		2017		21:18.5		67
75	Lily O'Dowd		B-CC			2016		21:19.7
76	Julie Thomasian		Churchill		2016		21:20.3		68
77	Susanna Maisto		Blair			2016		21:20.5		69
78	Isabel Present		Blair			2018		21:22.4		70
79	Hannah Bush		Churchill		2019		21:25.5		71
80	Elizabeth Lambert	Einstein		2016		21:25.6		72
81	Elizabeth Hepburn	Whitman			2019		21:26.0
Girls County Championship Team Projections (5+ Ranked Runners Required)
======================================================
Rank	School			Projected Points
======================================================
1	Walter Johnson 		     69
2	B-CC 			     75
3 	Whitman 		    115
4 	Richard Montgomery 	    170
5 	Wootton 		    192
6 	Clarksburg 		    229
7 	Blair 			    273
8 	Churchill 		    276
The Ranking Formula
Mocorunning's Ranking Formula is explained HERE. The ranking
formula compares runners to one another in every race throughout the season and year after year. The finish times only matter to the
extent that finish times of all ranked runners will be compared and scored against all other ranked runners in that race. After a meet
is scored, there is a point exchange among the ranked runners. The net point exchange will be zero with a few exceptions that I won't
go into right here. One of the important things to know is that there is no reward for running "fast times" and no penalty for running
"slow times." In other words there is absolutely no benefit to running a fast course like the DCXC course compared to a difficult course like Hereford. The most important thing for mobility within the
ranking is beating other ranked runners by as many seconds as possible.
The ranking you see on this page exactly matches the names on the week 7 ranking published on 10/19/2015 with a couple notable changes.
Private school runners were removed with the intention of projecting places and times for the county championship 5k course. The points
were replaced with projected finish times for the county championship course at Gaithersburg. Do the points convert directly to 5k
times? No, but the points do convert to a time scale. 1 second = 2 points. Therefore, if the top ranked runner had 400 points, she
would be ranked 400 points or 200 seconds above the cutoff to make the ranking. You can assign that top ranked runner any 5k time
imaginable, and she would be 200 seconds (3:20) above the cutoff to make the ranking. Take any two runners and subtract their point
totals, divide by two, and you will know how far apart they are "supposed" to finish according to the ranking.
To assign the projected times to all the runners, you really only need to assign a projected time to one runner. Once one runner has an
assigned projected time, the point scale dictates the finish times for every other runner within the ranking. But it's not the first or
last ranked runner that you want to key off of. It's the runners in the middle range that will be the most consistent year after year.
The great thing about the county championship is we have the same exact number of teams entered in the meet at the same time of year
every year. Of course weather is also a factor, but we have had great weather at the county meet for the last several years. The
caliber of the middle tier varsity runners will not fluctuate very much from year to year.
The chart below shows the county championship varsity race plotted for each of the last four years. The RED line is an average of those
four years, cut off at about 90th place. Under the assumption that this is an average year, meaning that this year's top 100 varsity
high school girls are no better or worse than a typical year, I want my YELLOW projected line to land on the red line as closely as
possible. I can't manipulate the curvature of the yellow line. The curvature of the yellow line is dictated by the ranking/points
system. I can only move my yellow line up or down vertically which I did until I felt that I had the best overlay. You can see that it
matches up very well for the top 45 girls, but it is certainly a little over-optimistic for the last 20-30 girls compared to what we
actually see in the real world. History tells us we won't have this many girls under 21:30, but maybe this will be the year the curve
is busted. Who knows? It is the best I can do given the relationship of the ranked runners as dictated by the points system. The yellow
and red lines line up well through the first 20 places, so I chose 11th place and assigned a time of 19:30.1 to the 11th place runner
and all the other times fell in line based on the points system.
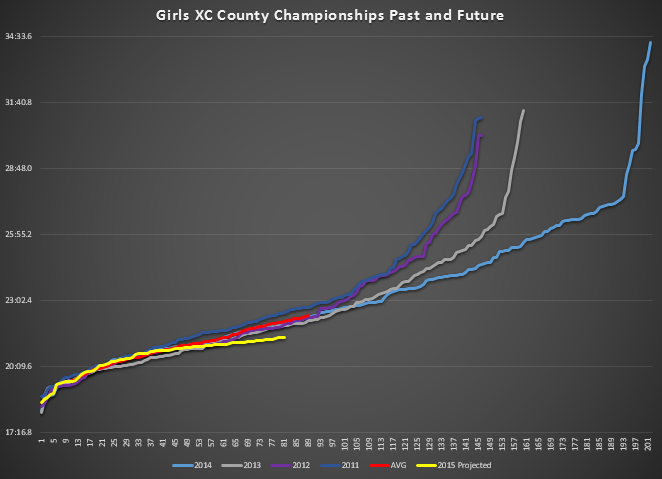
You will also notice that the 2014 curve seems drastically improved after about 125th place compared to previous years. It's because
last year was the first year that 10 individuals per team were permitted in the varsity race.
|